Introduction:
The foreign exchange (forex) market is a dynamic and fast-paced environment where traders use various tools and strategies to make informed decisions. Technical analysis plays a crucial role in understanding market trends and predicting potential price movements. One of the key components of technical analysis is the use of technical indicators. In this blog, we will delve into the world of forex technical indicators, exploring different types and their applications.
Trend Indicators:
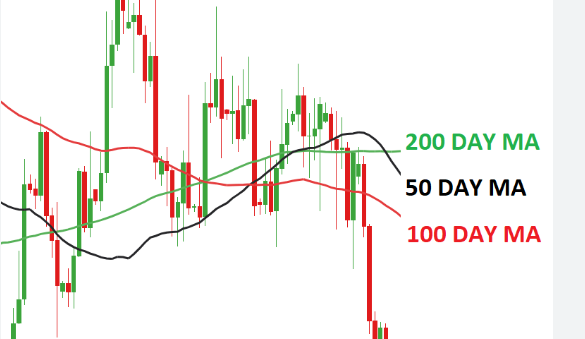
Moving Averages (MA): Moving averages smooth out price data to create a single flowing line, helping traders identify the overall direction of the trend. Common variations include simple moving averages (SMA) and exponential moving averages (EMA).
Average Directional Index (ADX): ADX measures the strength of a trend rather than its direction. Traders use it to determine whether the market is ranging or trending strongly.
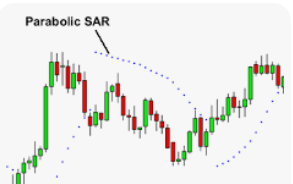
Parabolic SAR: The Parabolic Stop and Reverse indicator helps identify potential reversals in price direction. It appears as dots above or below the price chart, indicating potential trend changes.
Oscillators:
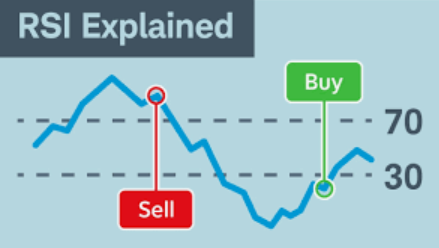
Relative Strength Index (RSI): RSI measures the speed and change of price movements. It ranges from 0 to 100, with levels above 70 indicating overbought conditions and levels below 30 suggesting oversold conditions.
Stochastic Oscillator: This indicator compares a security's closing price to its price range over a specific period. It helps identify overbought and oversold conditions, offering insights into potential trend reversals.
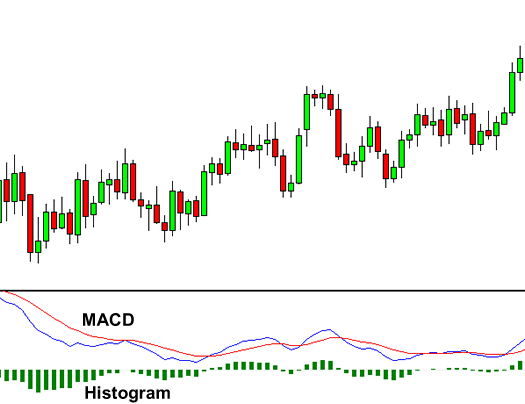
Moving Average Convergence Divergence (MACD): MACD consists of two moving averages – the MACD line and the signal line. Traders use the crossing of these lines to identify potential trend reversals.
Volume Indicators:
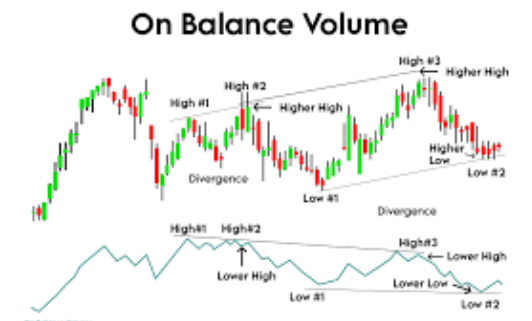
On-Balance Volume (OBV): OBV measures buying and selling pressure by adding or subtracting the volume based on the price movement. A rising OBV confirms an uptrend, while a falling OBV suggests a downtrend.
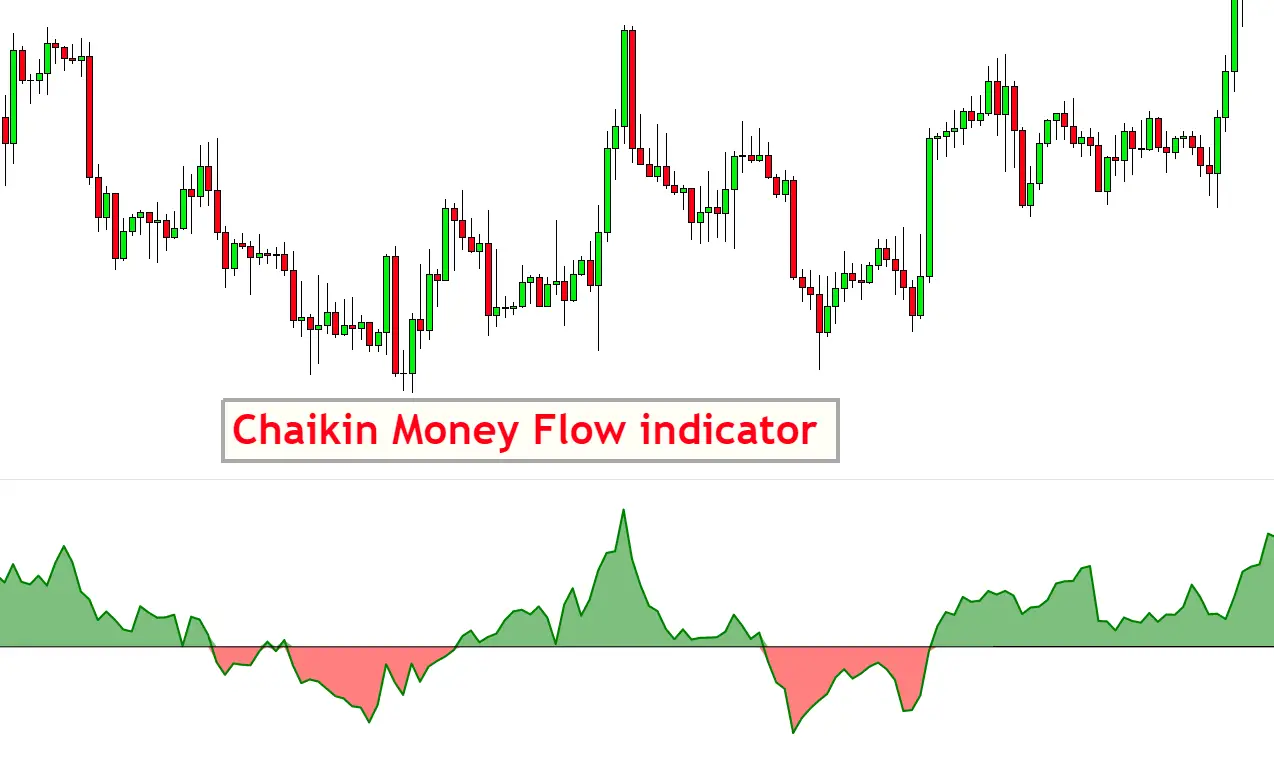
Chaikin Money Flow (CMF): CMF combines price and volume data to assess the flow of money into or out of a security. It helps identify potential trend reversals.
Momentum Indicators:
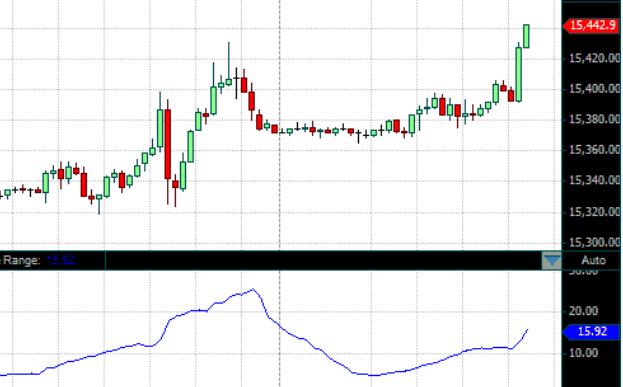
Average True Range (ATR): ATR measures market volatility, helping traders set appropriate stop-loss and take-profit levels. Higher ATR values indicate increased volatility.
Commodity Channel Index (CCI): CCI measures the current price level relative to its average over a given period. Traders use it to identify potential overbought or oversold conditions.
Volatility Indicators:
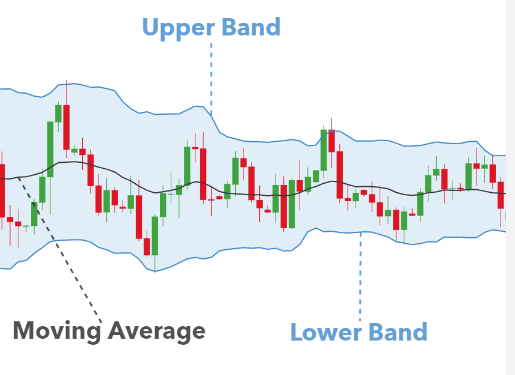
Bollinger Bands: Bollinger Bands consist of a middle band (SMA) and two outer bands that represent standard deviations from the middle band. Traders use them to identify volatility and potential trend reversals.
Average True Range (ATR): While mentioned earlier as a momentum indicator, ATR also serves as a volatility indicator, helping traders gauge the market's unpredictability.
Conclusion:
In the complex world of forex trading, technical indicators provide traders with valuable insights into market trends, momentum, and potential reversals. It's important to note that no single indicator guarantees success, and a combination of indicators often provides a more comprehensive analysis. Traders should carefully consider their trading strategy, risk tolerance, and market conditions when incorporating technical indicators into their decision-making process. As with any aspect of trading, continuous learning and adaptation are key to navigating the ever-changing landscape of the forex market.